


Training Development
The myth of the Dale’s Cone of Learning


Dales Cone of Learning is widely recognized and referred to in the Learning & Development field both academia and industry. But is the Dales Cone of Learning even real? We analyse here.
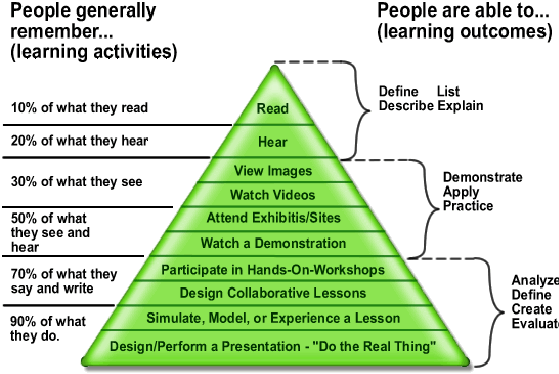
Dale’s Cone has been referred for explaining contemporary learning behaviors a total of 271 times in learning conferences globally this year. For those who do not recognize or associate with ‘Dale’s Cone of learning’ – it is a theory which relates to the instructional design and learning processes, and the impact of the kind of learning input on the retention ability and learning outcomes of students. Edgar Dale’s Cone of Learning says that “people remember 10 percent of what they read; 20 percent of what they hear; 30 percent of what they see; 50 percent of what they see and hear; 70 percent of what they say and write; and 90 percent of what they do as they perform a task.”Depending on the source of learning, the learning outcomes also vary – from a learner’s ability to ‘define’, ‘describe’, ‘list’ and ‘explain’ to ‘demonstrate’, ‘apply’, and ‘practice’; to ‘analyze’, ‘design’, ‘create’ and ‘evaluate’.
Only that there is no data with regards to the number of conferences where Dale’s Cone has been referred. And the fact that the learning theory has been referred in 271 conferences is as made up as the percentages in the Dale’s Cone. The number 271 wasn’t required in the opening statement, and there weren’t any in the original Dale’s Cone either. The percentages happen to be a random insertion to make the theory more appealing in the HR and L&Dfraternity – and incidentally, it has been working for a good 5-6 decades now.
Dale’s Cone has been the basis of several arguments for learning professionals to make a case for workshop-style learning and/or experiential learning, and it has been of significant help in understanding certain contemporary learner behaviors. Having said that, what is also true is that Edgar Dale never came up with the exact percentages in his ‘Cone of Experience’. The percentages and outcomes are a mere adaptation, and the pyramid has been incorrectly cited for years now in both academic and industry forums. It was uncovered in detail on Work-Learning Research, and that work forms the basis of this discussion.
The problem with the Cone
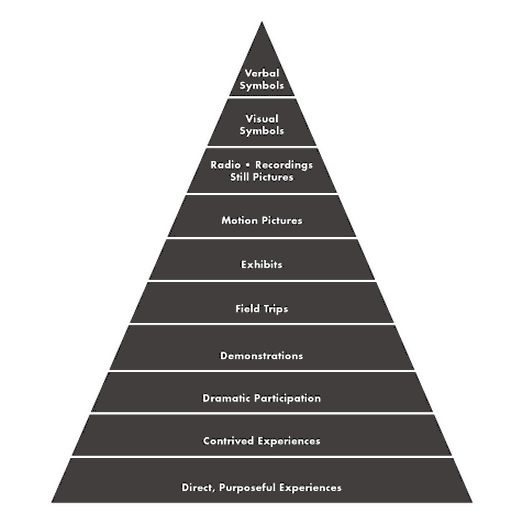
Edgar Dale was an American educator. He developed the ‘Cone of Experience’ in 1946, a concept on audio-visual methods in teaching.
![]()
As you can see in the graphical representation (original image here), neither did Edgar Dale include any percentages, nor did he mention any learning outcomes. He hadn’t based his cone on any scientific research, which he explicitly mentioned in his study, besides urging his readers to “not take it too seriously”.
There have been several “adaptations” of this ‘cone of experience’ as the ‘cone of learning’where people have come up with a variety of versions. The source of this ‘Cone of Learning’ is the amalgamation of Edgar Dale’s ‘Cone of Experience’ and D.G. Treichler’srandomly assigned percentages to people’s retention abilities in the magazine ‘Film and Audio Visual Communications’ in 1967. Will Thalheimerrefutes the designated percentages as ‘bogus’ because their origin is vague at best. NTL Institute for Applied Behavioral Science, the institute that is cited for the ‘cone of learning’ (adapted from Edgar’s ‘cone of experience’) has also been rationally critiqued for the credibility of the adaptation.
![]()
There are consistent inconsistencies in the attribution of this adaptation as well. While most of this is attributed to NTL, some academic papers also attribute it to other published works, and in some cases, incorrectly. For instance, Will Thalheimercontacted the first author from a citation of the ‘learning cone’ in a paper. The first author, Dr.Michelene Chi of the University of Pittsburgh didn’t “recognize” the graph and said, “The citation is definitely wrong; it isn’t my graph.”
The problem is not only that the wrong paper carrying inaccurate assumptions was cited, but the information written in many of those papers was not consistent. A lot of researchers had different adaptations of Cone’s Pyramid, and not all were based on the Dale’s Cone of Experience or Treichler’s percentages in his research. For example, a graphic in an academic paper cited to Chi1 , Lewis, Reimann and Glaser says that people remember 30 percent of what they hear… 80 percent when they are collaborating. Which is in direct contradiction with the text, that says people remember 20 percent of when they hear… 70 percent of what they say.
The deeper-lying issues
The belief in this falsified theory has a deep-lying meaning attached to it. Of course, the widely-accepted research has had implications on HR and L&D professionals – by making them inadvertently believe in the notions around the retention skills of people after reading, hearing, and experiencing learning, the research has led them to base their designs of learning interventions on these preconceived notions which are lacking any credible backing.
While there may have been follow-ups which may corroborate this hypothesis, the bigger question that this belief that academia and industry professionals have had on this ‘Cone of Learning’ for decades is how easily have people trusted something which isn’t credible and does not have a strong research backbone to it. It also makes one wonder what can practitioners even trust then?
Reference:-
1 The same researcher who said that the citation was wrong and couldn’t recognize the graph.
Author
Loading...
Loading...